We Predicted Every Outcome of Wistia's $60K Video Ad Experiment
We tested Wistia's $1K, $10K, and $100K video ads using 60 participants and simulated cognitive testing. Five prediction formulas correctly rank-ordered all six campaign outcomes before seeing any real results. The $10K video won every metric. Single scores and questionnaires both failed. Pre-launch attention testing predicted the same winner as Wistia's $60K ad campaign, for under $1K.
Can you predict which video ad will perform best before spending a single dollar on media?
We tested this with Wistia's One, Ten, One Hundred documentary — three ads for the same product, produced at $1K, $10K, and $100K budgets. Using 60 participants and five prediction formulas based on simulated cognitive activity, we correctly rank-ordered all six campaign outcomes before seeing Wistia's actual results from their documented $60K ad campaign. The $10K video won everything. The $100K video — despite being the most expensive and polished — lost. Here's what we found and why it matters for anyone spending money on video advertising.
When More Money Makes Worse Ads
Here's a stat that should change how you think about video production: the $100K video had the worst return on ad spend of all three videos tested.
Not the $1K scrappy, low-budget version. The $100K — professionally shot by Sandwich Video in Los Angeles, with a full crew, polished cinematography, and the production quality you'd expect from a Super Bowl spot.
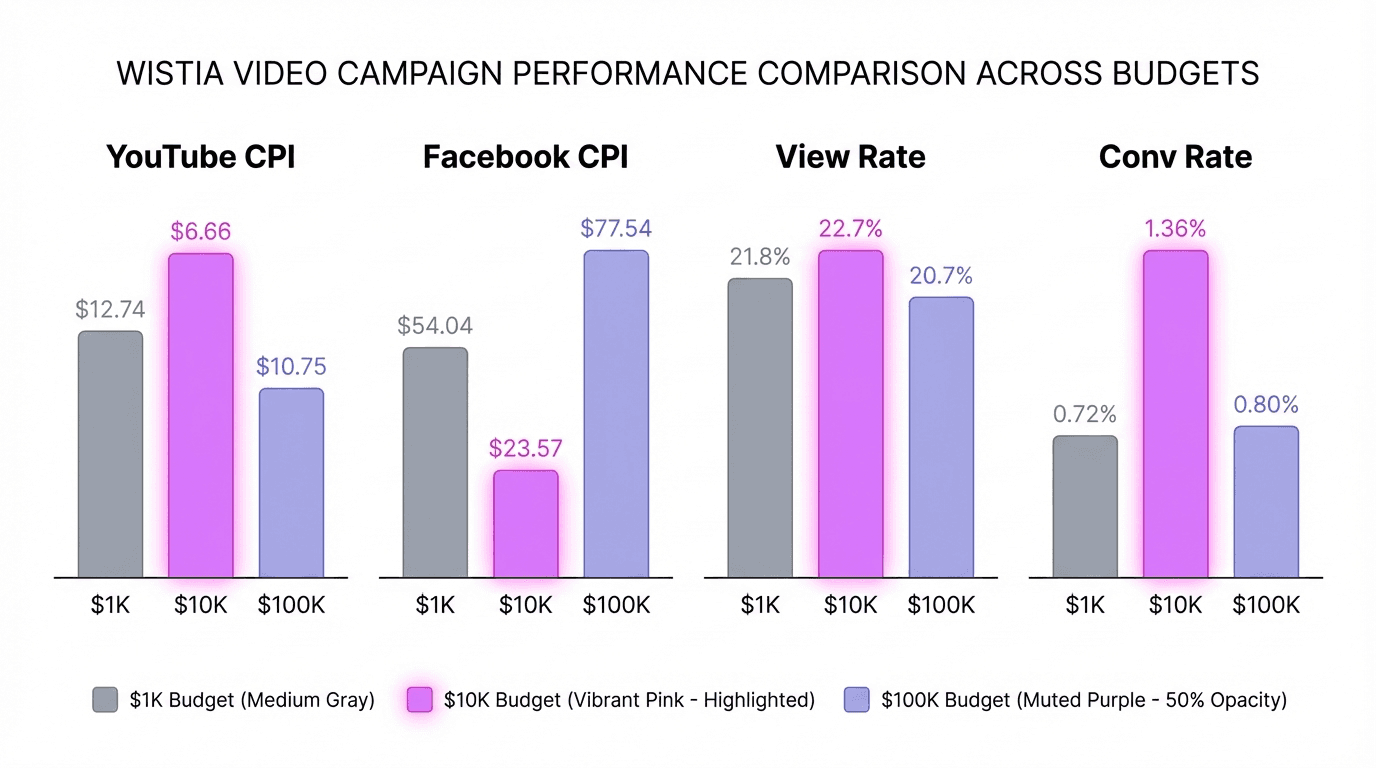
On YouTube, the $10K video delivered installs at $6.66 each. The $100K video? $10.75 — 61% more expensive per install. On Facebook, the gap was even wider: $23.57 versus $77.54.
"The $10K video struck the right balance between professionalism and authenticity."
— Chris Savage, CEO, Wistia
We didn't learn this from Wistia's report. We predicted it — using simulated cognitive testing with 60 participants, before reading a single page of their campaign data.
The $160K Experiment: A Real Campaign With Real Results
In 2018, Wistia ran one of the most transparent advertising experiments ever published. They challenged Sandwich Video to produce three ads for Soapbox — their webcam recording tool — at three radically different budgets: $1,000, $10,000, and $100,000.
Same product. Same agency. Same script concept. Only the budget changed.
Then Wistia spent $60K on a real ad campaign across YouTube and Facebook, targeting sales and marketing professionals. They published every result in a 40-page report: cost per install, cost per view, view rates, conversion rates — the full picture.
Here are the actual campaign results:
YouTube CPI
Facebook CPI
YouTube View Rate
YouTube Conv Rate
The $10K video won on every single metric. Not by a small margin — by a factor of nearly 2x on conversion rate and 3x on Facebook CPI compared to the $100K version.
"The biggest variable in video advertising is the video itself."
— Wistia Campaign Report, p.27
4 Hours, AI-Generated Audience + 60 Real Participants, Zero Media Spend
Before reading Wistia's results, we ran our own test.
We recruited 60 participants — 20 per video, split evenly between a target group (B2B marketers, sales professionals, SaaS users aged 25-45) and a non-target group (general population outside marketing and tech).
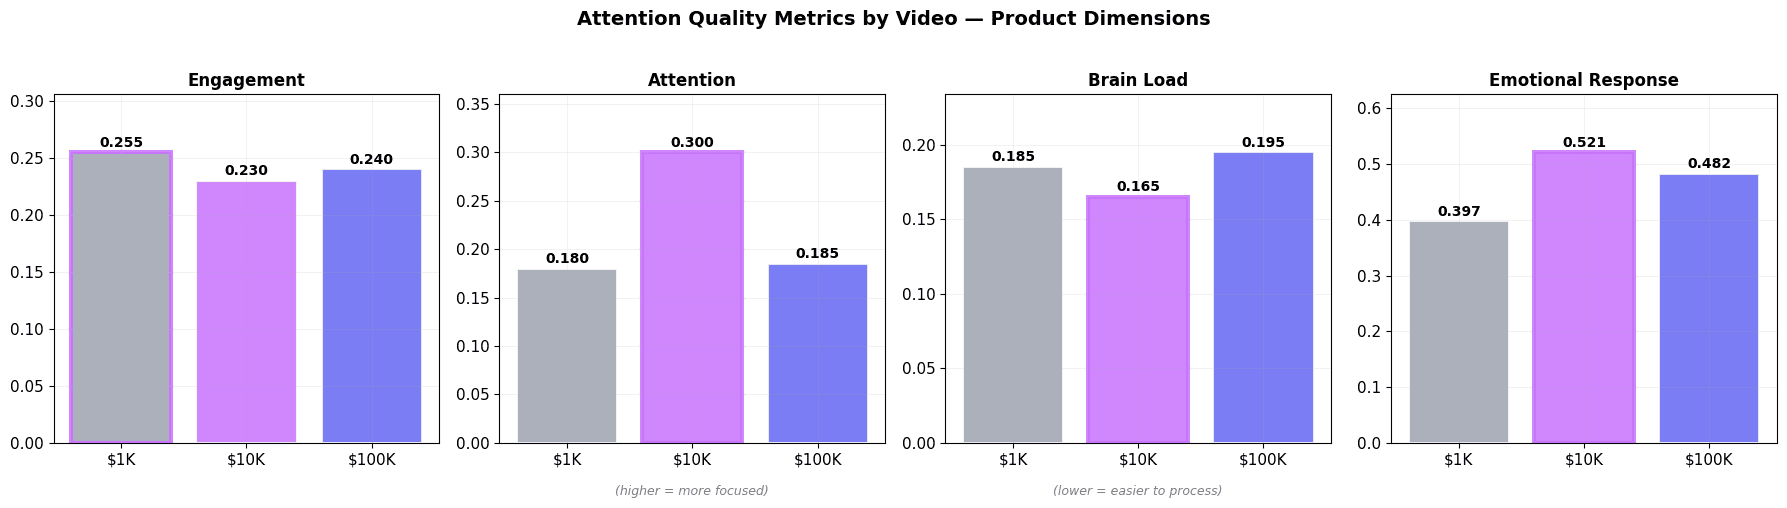
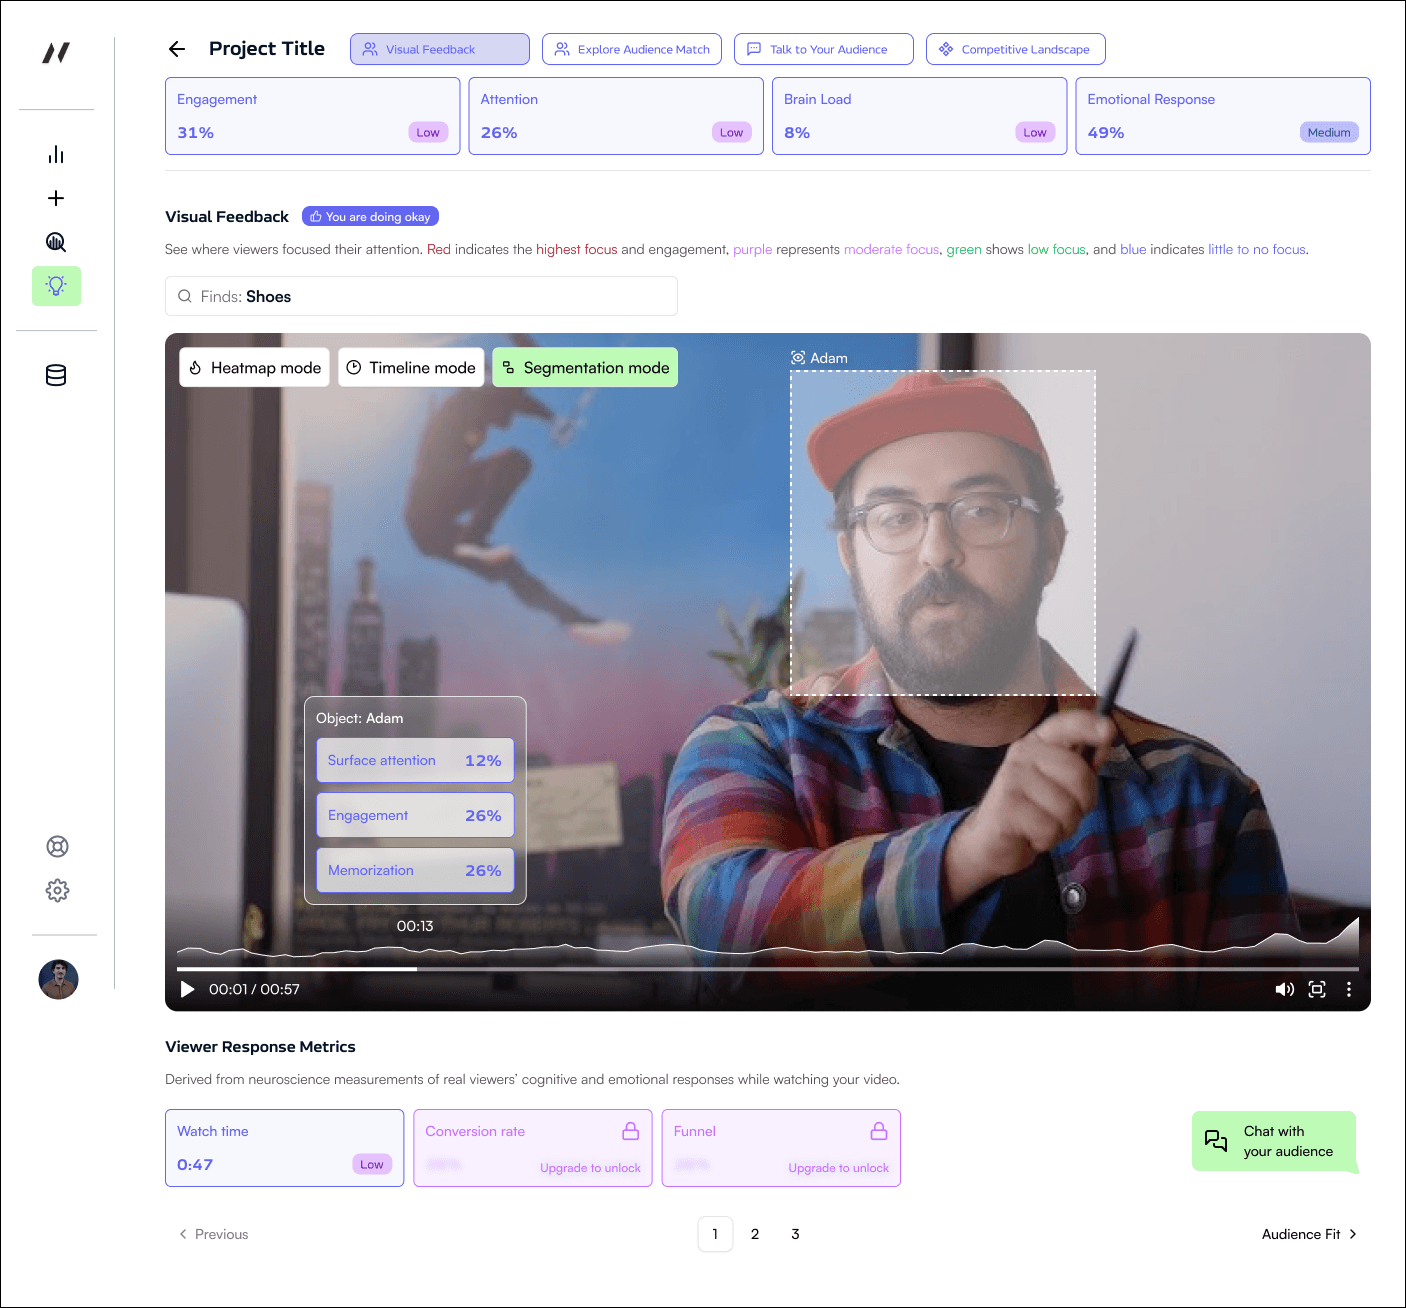
Each participant watched one of the three videos while our platform measured their simulated cognitive activity across four dimensions — engagement, attention, brain load, and emotional response — second by second. Real viewers. Real cognitive responses. Analyzed by AI in real time. No surveys. No self-reported opinions.
The entire test — three videos, 60 participants, full analysis — took under 4 hours total. The 4 hours is recruiting time and watching time. Our AI-generated audience model processes each viewer's cognitive data and generates synthetic audience predictions in seconds to minutes — not hours or weeks. A traditional focus group testing three video concepts would cost upwards of $50,000 and take 3-4 weeks.
What we found was that the three videos had nearly identical average engagement (~0.286 across all viewers). The differences that predicted real-world performance lived in the quality of attention — how focused viewers were, how easily they processed the message, and how strongly they responded emotionally.
The Ad Performance Funnel: Why No Single Metric Predicts Everything
The most important insight from this analysis isn't which video won. It's that different attention qualities predict different outcomes — and they're not always pointing at the same video.
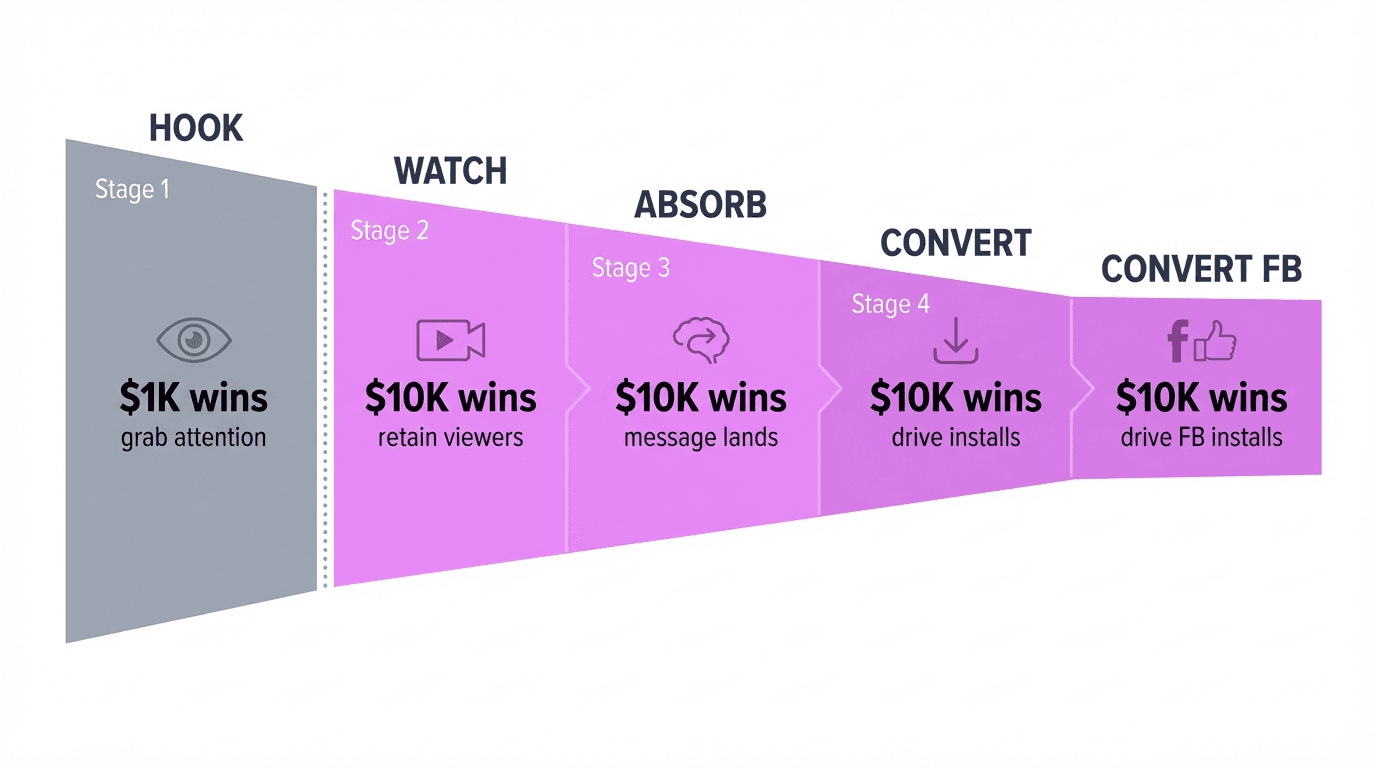
An ad performs across stages:
HOOK → WATCH → ABSORB → CONVERT (grab attention) → (retain viewers) → (message lands) → (drive action)
A video can ace the hook and fail at conversion. That's exactly what happened here.
The $1K Video — Best Hook, Worst Conversion
The $1K video had the cheapest cost per 25% view on YouTube: $0.37. It grabbed attention faster than either alternative. Our data showed it had the highest initial engagement and strongest emotional response in the first 15 seconds.
But it also had the most expensive installs: $12.74 on YouTube, $54.04 on Facebook.
People watched. They didn't act.
Even more revealing: the $1K video had a negative target delta. Non-target viewers (people outside marketing/tech) scored higher on engagement and emotional response than the intended audience. The ad resonated with the wrong people. In advertising terms, you'd be paying to reach viewers who will never convert.
Cheap views ≠ cheap conversions. The video that's cheapest to get watched can be the most expensive to get results from.
The $100K Video — Beautiful But Distracting
The $100K video had the highest raw attention score (71 general score). By that single metric, it should have won.
It didn't — because that attention was pointed at the wrong things.
The data showed significantly lower attention scores than the $10K video. Viewers were physically restless — scattered across the set design, the lighting, the cinematography rather than focused on the product.
Attention was the lowest of the three videos. In the $10K video, viewers focused on the same thing: the product, the message, the value proposition. In the $100K video, everyone was admiring something different.
"The $100K ad seemed too much like a commercial." — Survey respondent, Wistia Report, p.8
Beautiful production created a scattered viewing experience. Brain Load confirmed it: $100K viewers processed the content with more effort, not less — spending cognitive resources on the filmmaking rather than absorbing the message.
The $10K Video — The Goldilocks Zone
The $10K video won because it optimized for the thing that actually matters: message clarity.
Here's what the data showed:
Lowest Brain Load for the target audience. The message landed effortlessly. The $1K and $100K videos both required more processing effort — and brain load compounds. Every fraction of additional effort means more viewers who disengage before acting.
Highest Attention score. All viewers were focused on the same elements — the product demo, the value proposition, the call to action. No wandering eyes.
Strongest Emotional Response from the target audience. Viewers were locked in — deeply focused, physically still. This is the behavioral signature of sustained immersion.
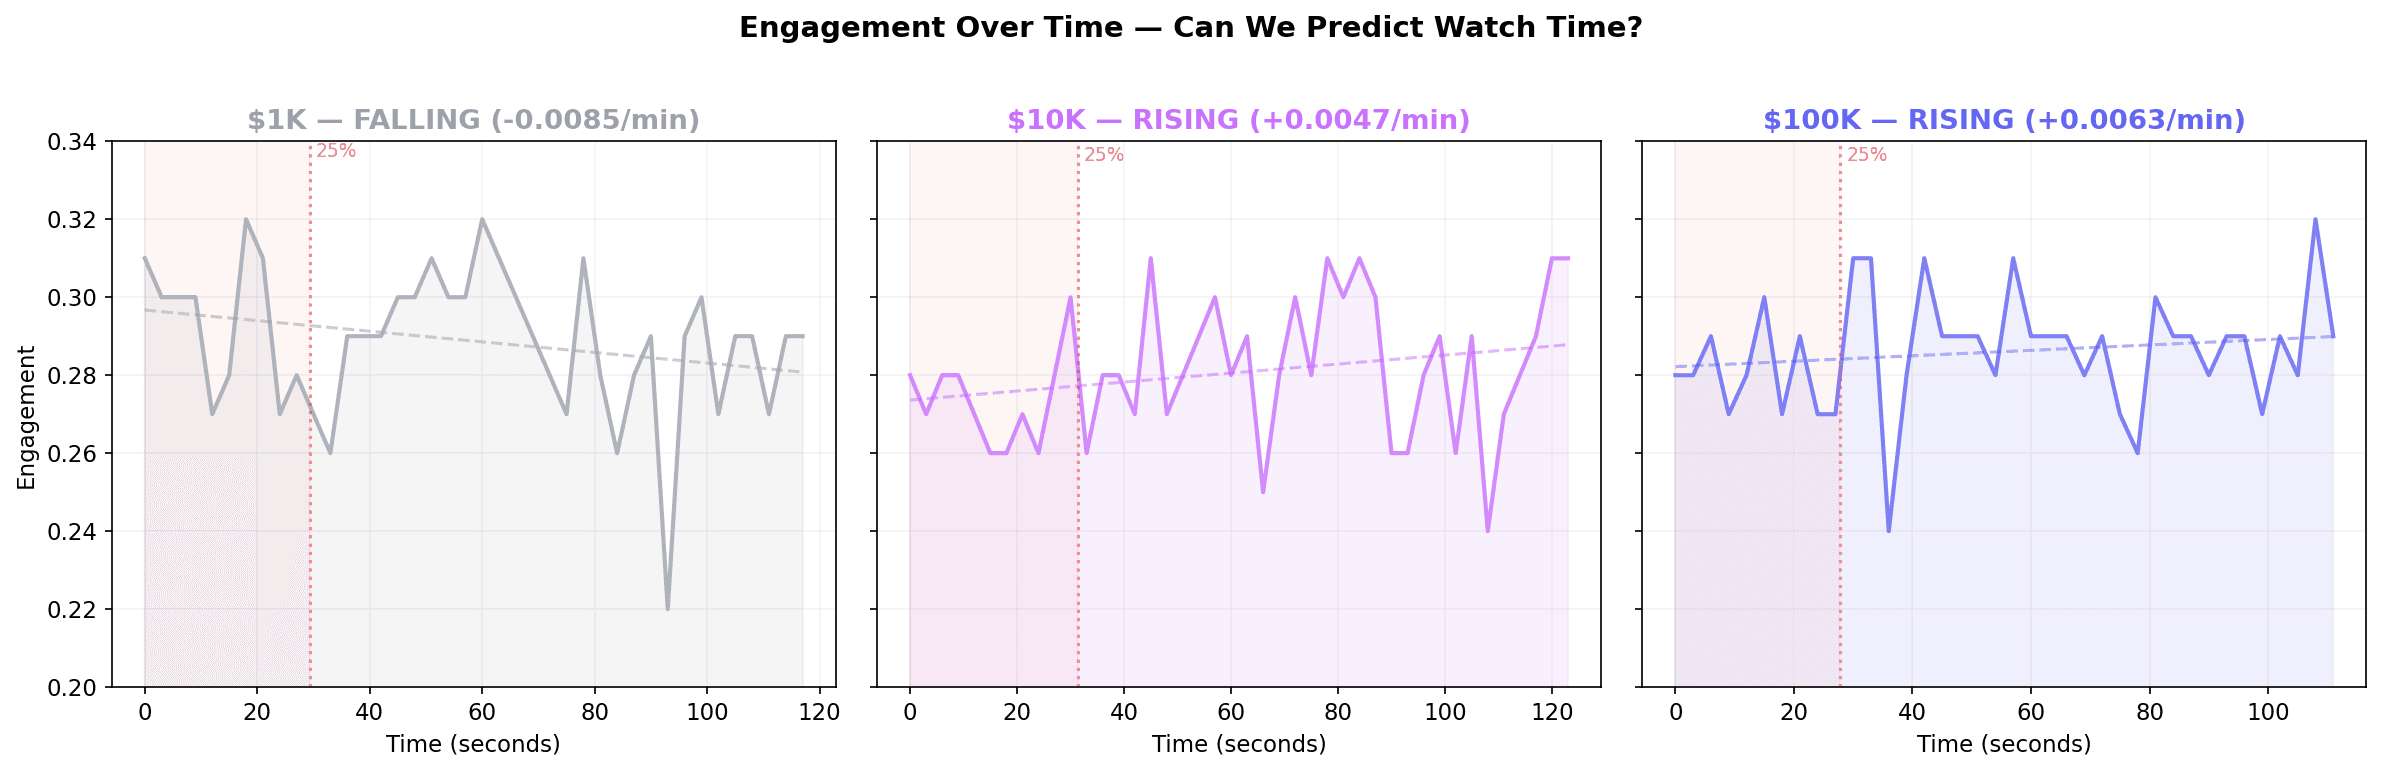
Rising engagement curve. While the $1K video's engagement declined over time and the $100K stayed flat, the $10K video actually built engagement through the middle — peaking around 78-84 seconds in. This is the rare pattern where viewers become more engaged as the video progresses, not less.
And perhaps the most powerful signal: Brain Load differential. The $10K video was easy for its target audience but significantly harder for non-target viewers. It naturally filtered its audience. The right people absorbed the message effortlessly. The wrong people tuned out.
This is the signature of a well-targeted ad: easy for the people who matter, hard for everyone else.
5 Formulas, 5 Outcomes, All Correct
We built five prediction formulas, each mapping specific attention qualities to a specific campaign outcome. None of them use a single metric — they combine multiple signals to capture what's happening at each stage of the ad funnel.
Winner (Predicted)
Winner (Actual)
Hook Strength
YouTube CP25V
$1K ($0.37)
Watch Retention
YouTube View Rate
$10K (22.7%)
Message Clarity
YouTube Conv Rate
$10K (1.36%)
Conversion Efficiency
YouTube CPI
$10K ($6.66)
Facebook Efficiency
Facebook CPI
$10K ($23.57)
Every formula produced a perfect rank-order match across all three videos.
Why Not Just Use One Number?
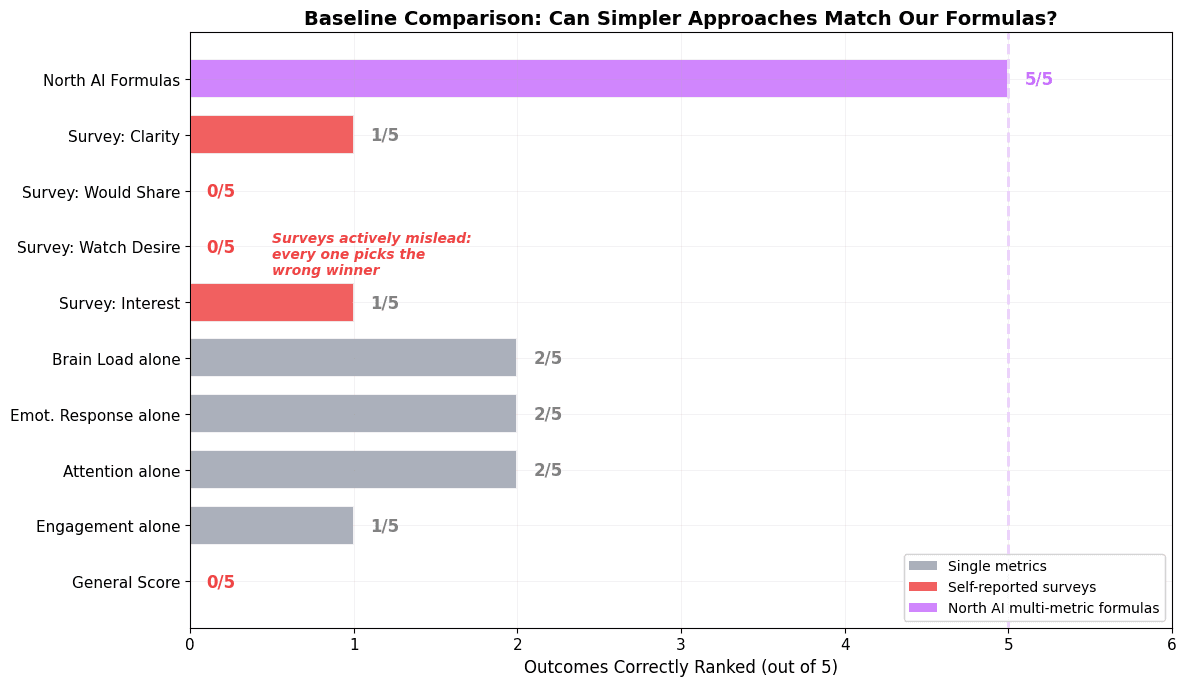
We tested every simpler alternative. If a single metric could do the job, our multi-metric formulas would be unnecessary. Here's what we found:
Outcomes correctly ranked (out of 5)
General Score (one number)
0 out of 5
Engagement alone
1 out of 5
Attention alone
2 out of 5
Self-reported interest (questionnaire)
1 out of 5
North AI formulas (matched to outcome)
5 out of 5
Questionnaire data was even more misleading. Every self-reported metric picked the wrong winner. Viewers said they preferred the $1K video (highest interest, highest sharing intent) and the $100K video (highest watch desire). The $10K — which won every single campaign metric — ranked last on viewer interest and story clarity.
A Note on Limitations
We want to be transparent about what this proves and what it doesn't.
- Rank-Order vs. Absolute Values: We predict rank-order, not absolute values. We can tell you which video will perform best, but we can't yet say "this video will have a CPI of exactly $6.66."
- External Variables: Campaign outcomes depend on more than creative. Targeting, bids, placements, and budget allocation all play a role.
Why Pre-Launch Testing Is Becoming Standard Practice
This case study sits within a broader industry shift from viewability metrics to attention measurement. The old standard for "viewable" advertising was simple: 50% of pixels visible for 2 seconds. That bar tells you almost nothing about whether your message was seen, processed, or acted on.
The industry is waking up. According to EMARKETER's 2025 survey, 36% of US ad buyers now plan to prioritize attention metrics over viewability. Adelaide's 2024 analysis found that attention-based optimization delivered an average of 40% upper-funnel lift and 53% lower-funnel lift.
But here's the gap: most attention measurement still happens after the media budget has been spent. Pre-launch testing closes this gap.
Three Takeaways for Your Next Video Campaign
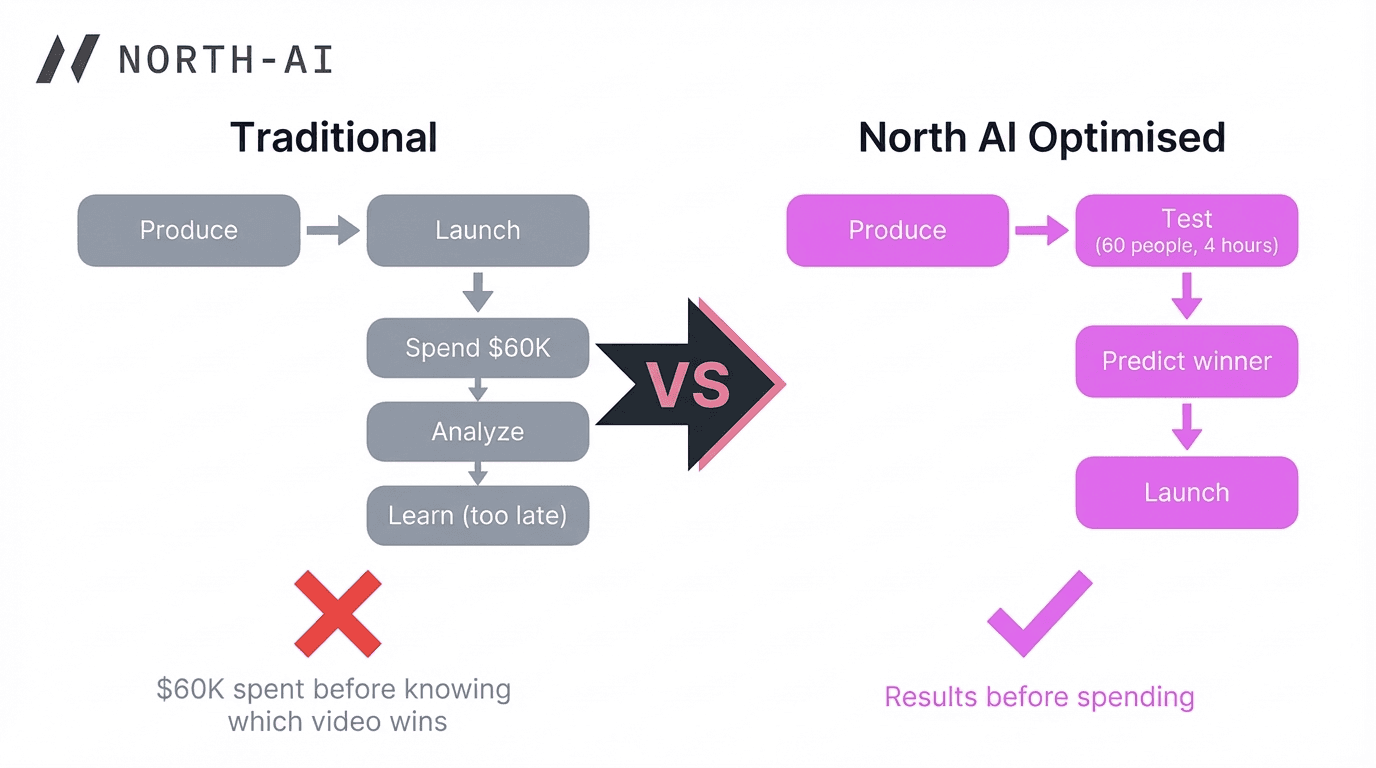
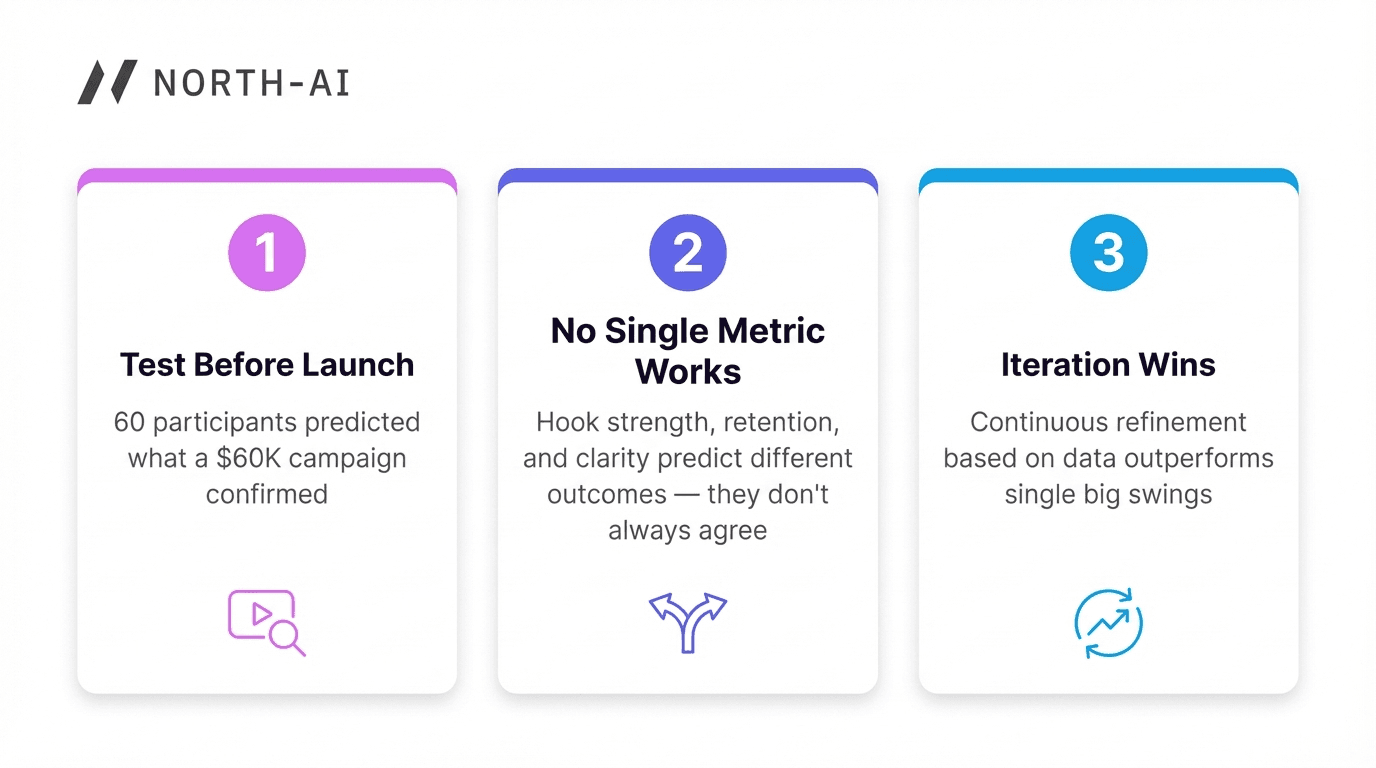
- Test creative before launch, not after. Post-launch A/B testing still burns budget on the loser. Wistia spent $160K total to learn which video worked best. Pre-launch attention testing predicted the same result for under $1K.
- No single metric predicts everything. Hook strength predicts cheap views. Message clarity predicts conversion. They don't always point at the same video. Know which stage of the funnel matters most for your campaign.
- Production budget is not the variable that matters most. The $100K video had no meaningful advantage over the $10K despite costing 10x more to produce. Low brain load and high attention predict conversion better than production polish.
From Creative Intuition to Creative Evidence
Wistia's One, Ten, One Hundred explored the relationship between budget and creativity. Our analysis adds the missing dimension: measurement before launch. The brands and agencies that adopt pre-launch creative testing will stop wasting media budget on underperforming creative — and start launching with evidence, not just intuition.
Key Takeaways
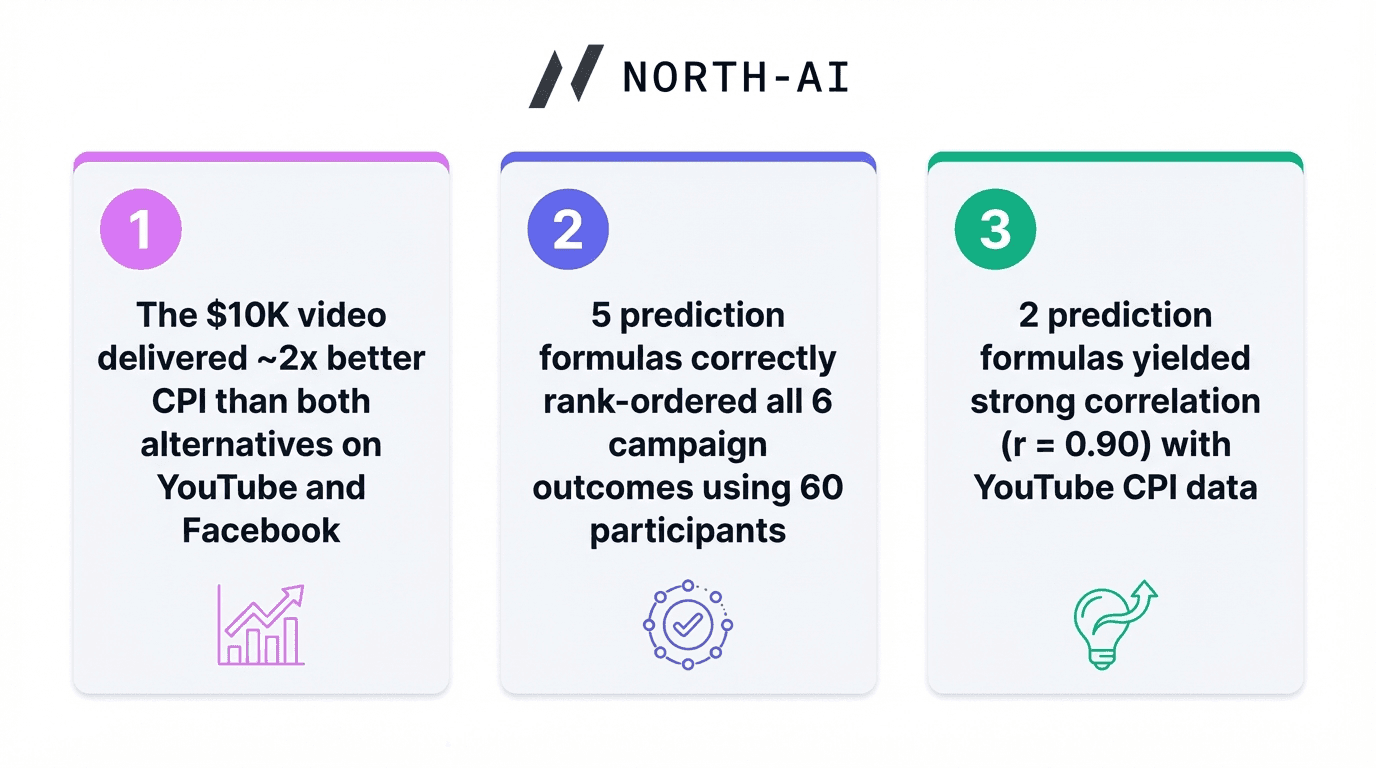
- The $10K video delivered ~2x better CPI than both alternatives on YouTube and Facebook
- 5 prediction formulas correctly rank-ordered all 6 campaign outcomes using 60 participants
- Single Score alone predicted zero outcomes — the one-number approach fails
- Every questionnaire metric picked the wrong winner
- "Cheap views ≠ cheap conversions" — the $1K had the cheapest views but the most expensive installs
Predict Performance Before You Spend
Run this in the simulator
Drop in a video, image, or copy. Get attention, engagement, and emotional response across 7 platform models in minutes.